Ecommerce revenue and ad spend in one report
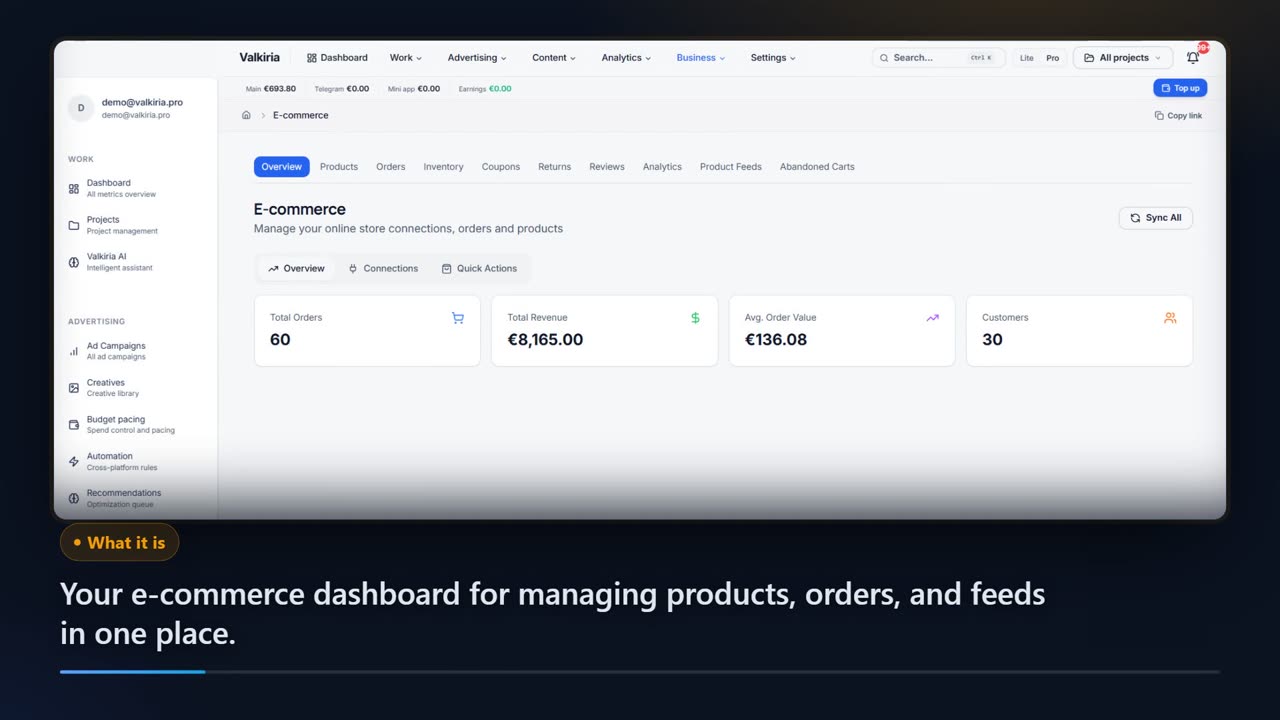
Valkiria pulls orders, products, stock, coupons, returns, reviews and abandoned carts out of your store and puts them next to spend across 11 ad platforms. Every order keeps its utm_source, so revenue is readable by channel instead of as one lump sum.
01What hurts
Why the store and the ad account live in separate reports
Revenue here, spend there
The ad account knows what was spent, the store knows what was sold, and the only thing joining them is a spreadsheet someone updates once a month at best.
Budget runs on products you cannot ship
A SKU hits zero in the warehouse while the campaign keeps sending traffic to it: the clicks are paid for, the cart never fills, and you find out at the end of the week.
Abandoned carts sit untouched
The shopper left an email address and walked away, no recovery mail went out, and a week later that cart is not a delayed order — it is a line in the loss column.
Scroll to see it work
E-commerce in four moves
- 01Scattered
Without E-commerce, this work is spread across spreadsheets and tabs.
- 02Connected
E-commerce reads the accounts and data you have already connected.
- 03Found
It highlights what matters now, with the evidence behind it.
- 04Approved
You decide what happens next: what applies on its own and what waits for approval.
02How it works
Three steps from store to a shared report
- 01
Connect the store
Shopify connects over OAuth: you enter a domain like mystore.myshopify.com and approve access. WooCommerce needs a REST API key pair from your store settings.
- 02
Sync the catalogue
Orders, products, customers, stock, coupons, returns, reviews and abandoned carts are pulled into Valkiria, and one button syncs every connected store at once.
- 03
Work from shared numbers
Revenue by platform, top products, low-stock warnings and product feeds all come off the same data. Live ad edits stay off until you switch them on for an account, and you choose how much needs your approval.
03What you get
What shows up in the report once the store is connected
Orders that name their source
Every order keeps its utm_source, so revenue reads per platform instead of arriving as a single monthly total.
01Stock you can see
Total stock, low stock and zeros per SKU with its own threshold, and quantities you can correct straight from the inventory table.
02Abandoned cart recovery
A cart counts as abandoned after an hour, the recovery email goes out on a button, and recovery rate and value are tracked separately.
03Product feeds
A Google Shopping or Facebook catalogue feed in XML, CSV or JSON, with a public URL and a check on price, image and description.
04Store analytics
Revenue, orders, average order value, customers, paid and refunded orders, top products and platform split over 7, 30, 90 days or all time.
05The store next to the ads
Shopify and WooCommerce are measured with the same metrics as the 11 ad platforms — no export step and no second dashboard.
0604In numbers
- 2
- store platforms supported natively: Shopify and WooCommerce
- 3
- product feed formats: XML, CSV and JSON
- OFF
- live edits until you switch them on for an account
Who gets what
What each type of client takes away
What you connect
- Shop & orders
- Ad accounts
- Catalogue feed
- Website
What Valkiria does
- 01Match orders to ads
- 02Watch pacing and fatigue
- 03Propose budget moves
What you get
- Action plan
- Sales by campaign
- Pacing report
Connect the store to the ads and see which campaigns actually sell
Shopify or WooCommerce orders, products and stock land next to Shopping and catalogue campaigns.
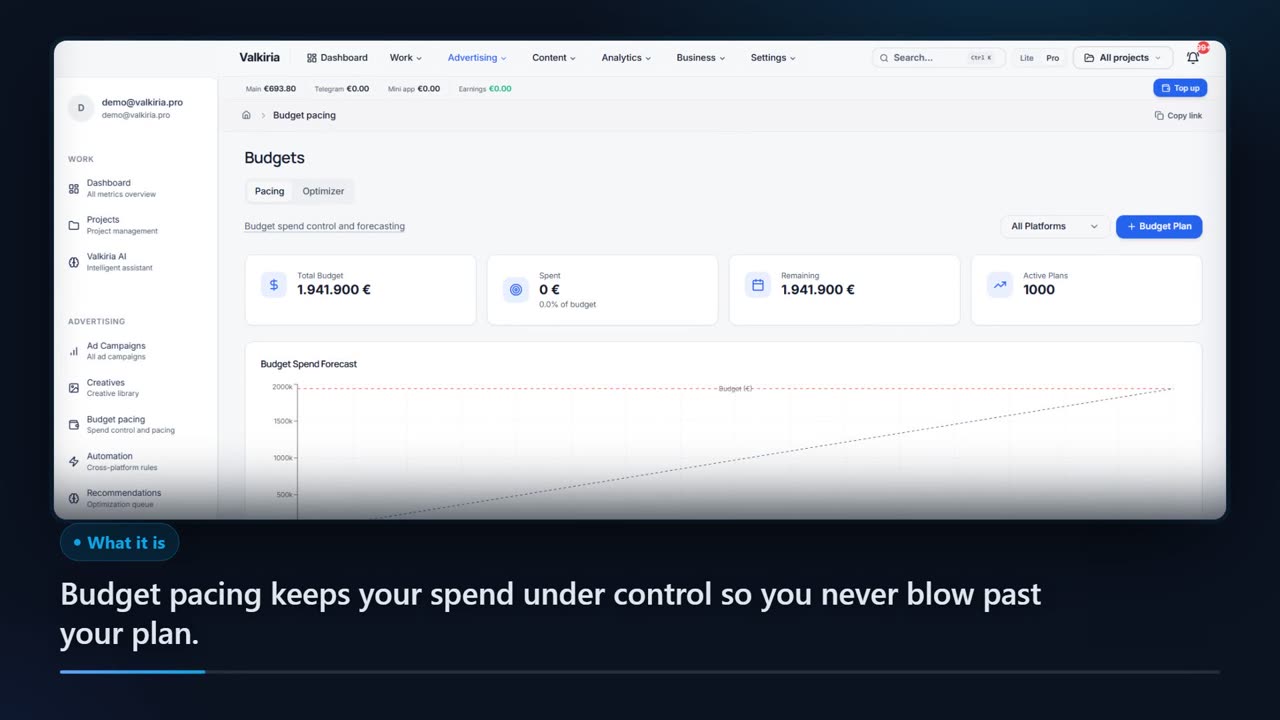
Budget pacing shows expected versus actual spend per campaign and projects the month.
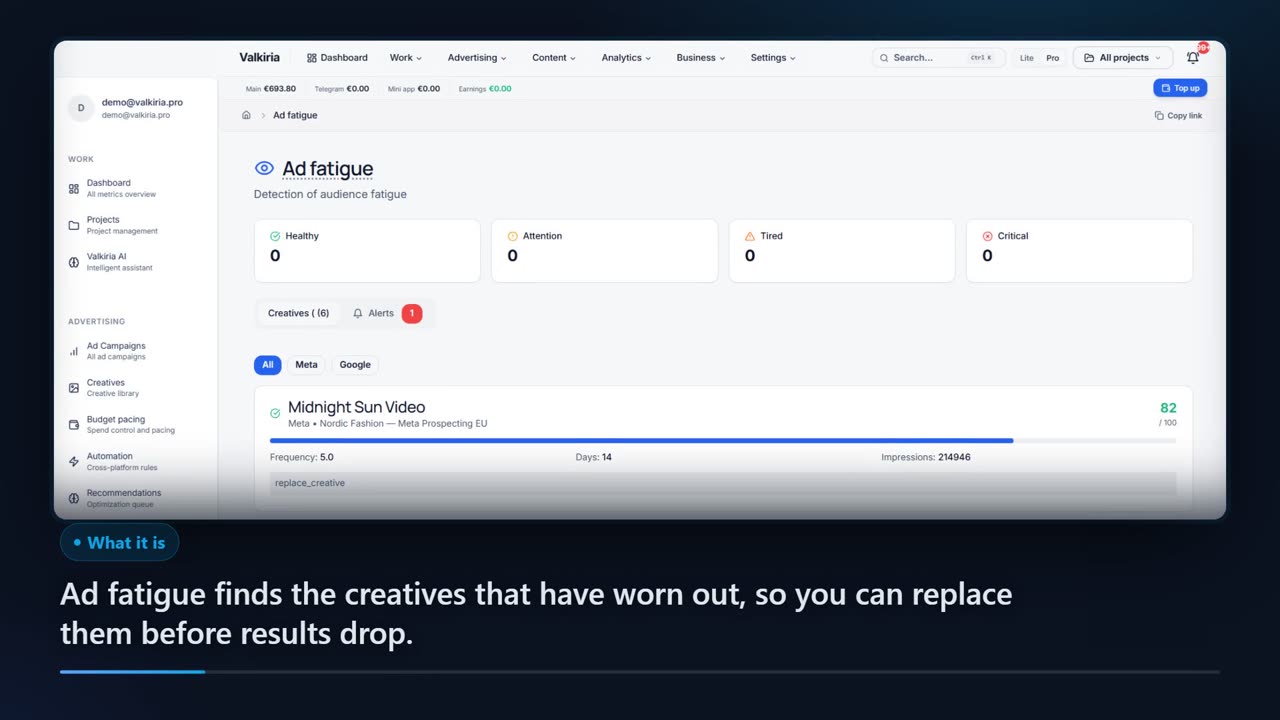
Frequency, CTR and conversion trends flag ads to refresh before results drop.
Modules that do the work
05FAQ
Questions about connecting a store
06See also
All modulesStart now
Put the store and the ad budget on one page
Connecting takes a couple of minutes and the sync only reads your store. What you do with the advertising afterwards stays your call.