A market report where every number cites its source
Valkiria gathers market, competitor and audience data, writes it up as a 12-section report and puts an [E#] link to the source next to every fact. Numbers that are not in the sources are flagged in the text instead of quietly passing through.
01What hurts
Why market reports fall apart in front of a client
Confident numbers, no source
The deck says the market grows 18% a year and nobody can say where the 18% came from. You cannot defend a budget with that, and checking it by hand is a week of work.
The source is a competitor's press release
Half of the «market data» comes from PR wires and corporate blogs. That is paid self-promotion, yet inside a report it looks exactly as solid as national statistics.
The report is read once and filed
A hundred pages of analysis still do not answer «what do we do on Monday»: no priorities, no owners, no metric that will show whether it worked.
Scroll to see it work
Market Intelligence in four moves
- 01Scattered
Without Market Intelligence, this work is spread across spreadsheets and tabs.
- 02Connected
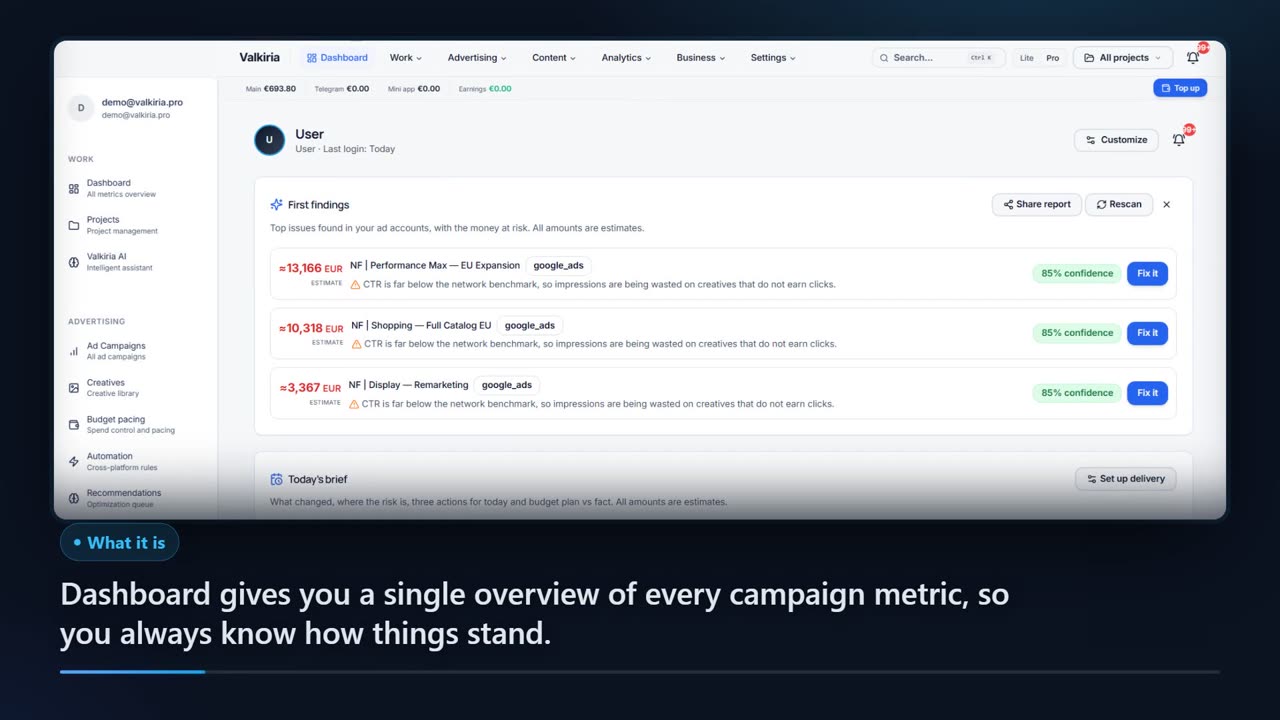
Market Intelligence reads the accounts and data you have already connected.
- 03Found
It highlights what matters now, with the evidence behind it.
- 04Approved
You decide what happens next: what applies on its own and what waits for approval.
02How it works
How a report is built — three steps
- 01
Brief and collection
You set the market, countries, vertical and the question. The system collects statistics, media, competitor sites and social signals into an evidence ledger.
- 02
Grounded synthesis
The 12 sections are written only from ledger facts. Every source gets a trust tier, numbers are checked against the cited [E#], and outliers are marked disputed.
- 03
The action plan
The finished report becomes a visual plan: diagnosis, targets, phases with steps, owners and KPIs — with a checklist, a PDF and a link for the client.
03What you get
What ships with the report
Twelve sections in order
Summary, market size, trends, competitors, audience segments, channels and benchmarks, pricing, social signals, SWOT, risks, recommendations, methodology.
01An [E#] link on every fact
Clicking the marker opens the source card: title, domain, date. The report reads like analysis and audits like a document.
02Source trust tiers
Official statistics and platform metrics outweigh a corporate blog or a press release, and self-interested or promotional sources are flagged separately.
03Cross-source corroboration
A fact confirmed by independent domains is separated from a single-source claim, and metrics far from the median are marked disputed.
04Numbers checked against sources
Every figure in the prose is looked for in the evidence it cites. If it is not there, the sentence keeps a «not supported by sources» note.
05Action plan and sharing
Diagnosis, phases, channel budgets and KPIs on one screen, exported to PDF or shared through a link with a password and an expiry date.
0604In numbers
- 12
- sections in every professional report
- [E#]
- source marker next to each factual claim
- 0
- numbers in the text without a source in the ledger
Who gets what
What each type of client takes away
What you connect
- Ad accounts
- Analytics
- Website
- Bank & invoices
What Valkiria does
- 01Collect spend and results
- 02Find leaks and gaps
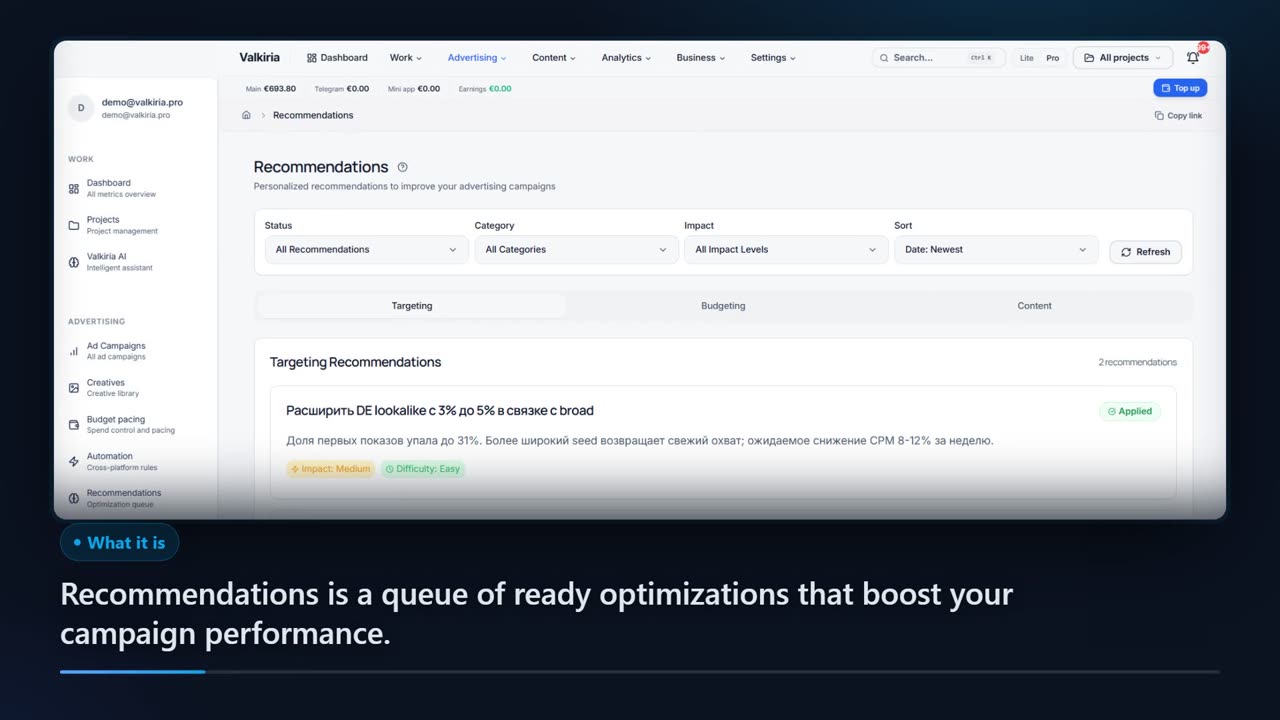
- 03Propose next steps
What you get
- Action plan
- Owner report
- Spend control
See every ad budget and what it returns, without opening five dashboards
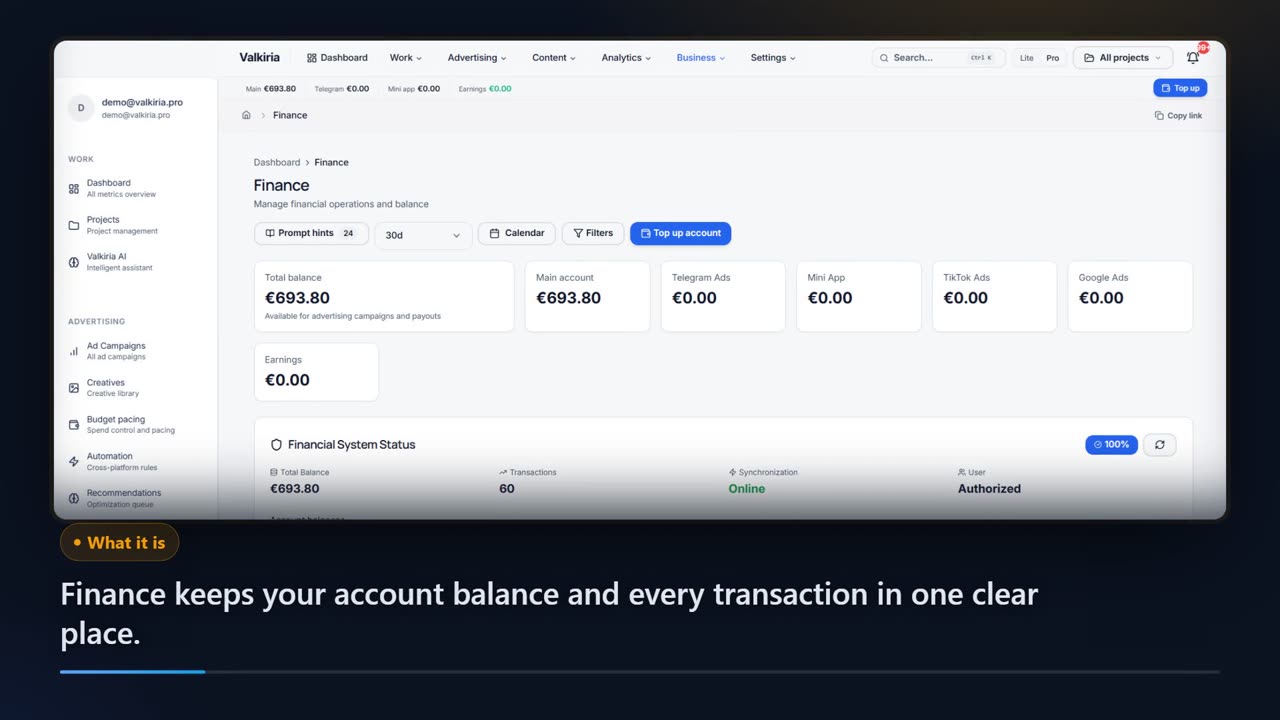
Google, Meta, TikTok and the rest in one view, in your currency, with results next to costs.
Findings turn into a prioritised list of next steps with the evidence behind each one.
New campaigns are created paused. Edits to live campaigns stay off until you switch them on for an account; deletions and new spend always wait for approval.
Modules that do the work
05FAQ
Questions about the reports and the data
06See also
All modulesStart now
Build your first report on your market
All it takes is a market, a country and a question. The report arrives with its source ledger, so the biggest sceptic on your team can check it.