29 data sources, each with an honest status
Data Hub shows where your data comes from, what it is assembled into and where it goes: 29 sources, 14 destinations and five ready-made datasets. Flows ship switched off, and writing to an external system waits for the owner's approval.
01What hurts
Why the numbers don't agree even when everything is 'connected'
Every system lives on its own
Ads in one console, web analytics in another, CRM and call tracking in a third. The summary is stitched together by hand at month end — after the decisions were made.
A zero means two different things
A zero on the dashboard is either a real zero spend or a sync that failed. Until those are told apart, the report and the AI summary are wrong with equal confidence.
Connecting stalls at platform review
Your own developer app, a scope list, screenshots and a review on the platform's side. The integration sits for weeks and nobody remembers which step it stopped at.
Scroll to see it work
Data Hub in four moves
- 01Scattered
Without Data Hub, this work is spread across spreadsheets and tabs.
- 02Connected
Data Hub reads the accounts and data you have already connected.
- 03Found
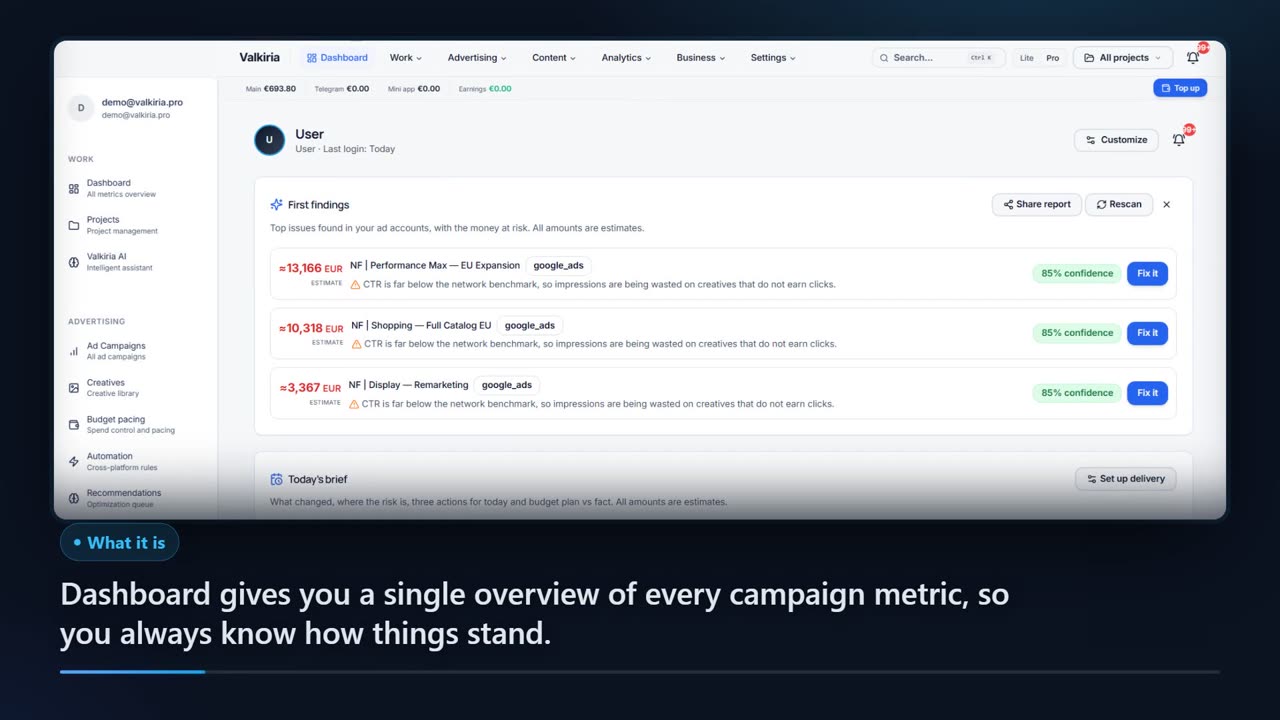
It highlights what matters now, with the evidence behind it.
- 04Approved
You decide what happens next: what applies on its own and what waits for approval.
02How it works
How data moves through Data Hub
- 01
Pick the sources
The catalog holds 29 connectors. Each one shows its readiness — live, partial, planned or waiting on platform review — and the current state of the connection.
- 02
Assemble the dataset
Five ready templates: PPC, SEO, ecommerce, lead quality and an executive summary. Currencies are normalised, rows deduplicated, suspicious zeros flagged.
- 03
Send it to destinations
Dashboard, report builder, client portal, spreadsheets, BI tools and exports. Writing turns on only with the owner's approval, and every run is logged.
03What you get
What you get in Data Hub
A catalog of 29 sources
Ad platforms, web analytics, ecommerce, CRM, finance, call tracking and aggregators — each with its auth type and the list of streams it provides.
01Readiness stated honestly
Every source says whether it is live, partial or still planned, and what exactly is blocking the connection right now.
0214 destinations
From the dashboard and report builder to Google Sheets, Excel, Looker Studio, Power BI, BigQuery, Snowflake, webhooks and CSV/JSON exports.
03Suspicious-zero protection
The dataset separates a zero the platform returned from data that never arrived, and shows source coverage next to the metric.
04AI grounded in the dataset
An AI answer has to cite the dataset, the source, the date range, freshness and row count. On stale or thin data the recommendation is blocked.
05App setup assistant
Each provider gets a packet: required scopes, the developer portal link, the evidence list and the current status. Review and approvals stay with a human.
0604In numbers
- 29
- data sources in the connector catalog
- 14
- destinations: sheets, BI, warehouses, webhooks
- 0
- writes to an external system without owner approval
Who gets what
What each type of client takes away
What you connect
- Ad accounts
- Analytics
- Website
- Bank & invoices
What Valkiria does
- 01Collect spend and results
- 02Find leaks and gaps
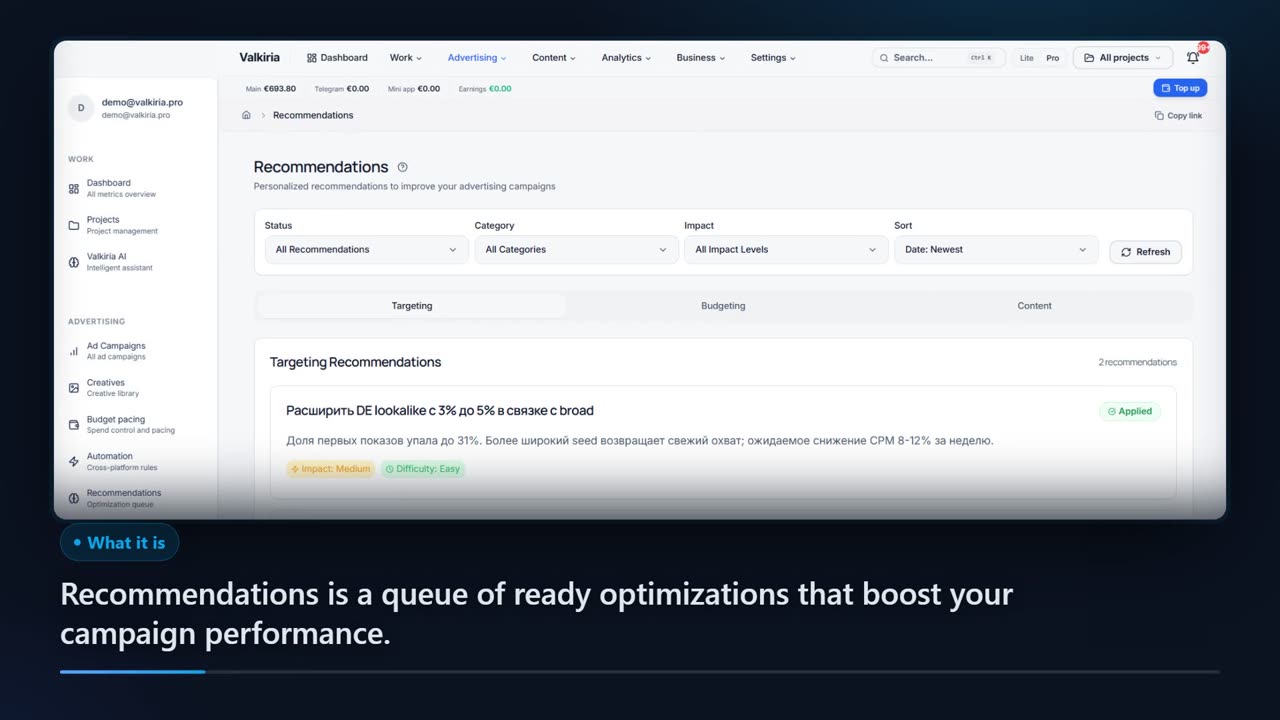
- 03Propose next steps
What you get
- Action plan
- Owner report
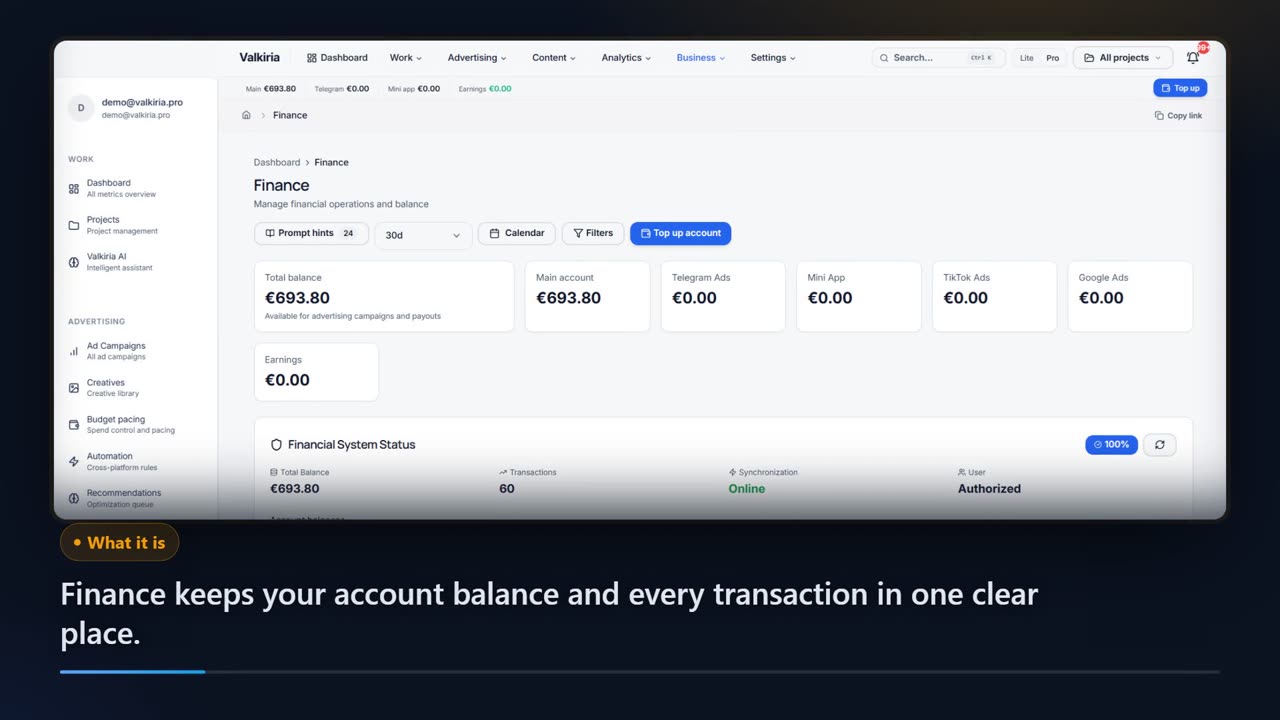
- Spend control
See every ad budget and what it returns, without opening five dashboards
Google, Meta, TikTok and the rest in one view, in your currency, with results next to costs.
Findings turn into a prioritised list of next steps with the evidence behind each one.
New campaigns are created paused. Edits to live campaigns stay off until you switch them on for an account; deletions and new spend always wait for approval.
Modules that do the work
05FAQ
Questions about Data Hub
06See also
All modulesStart now
Get your data into one place
The source catalog is open to browse and the flows ship switched off. Nothing is written outward until you allow it.