Ten ad networks in one table
Valkiria queries your connected Windsor.ai connectors and folds spend, impressions, clicks, CTR, CPC and conversions from ten networks into one report for the period you pick. The module only reads: it writes nothing back to the ad accounts.
01What hurts
Why the all-channel summary is always late
The joint view is built by hand
Export from every network, paste into a spreadsheet, reconcile currencies and metrics — and by the time it is ready the report describes last week.
The share of budget is invisible
Everyone has the per-platform numbers; nobody has the answer to which network eats half the budget and what it returns for it.
A broken connector flatters the report
When a platform stops returning data its row simply disappears, and the total looks better than the situation actually is.
Scroll to see it work
Cross-platform analytics in four moves
- 01Scattered
Without Cross-platform analytics, this work is spread across spreadsheets and tabs.
- 02Connected
Cross-platform analytics reads the accounts and data you have already connected.
- 03Found
It highlights what matters now, with the evidence behind it.
- 04Approved
You decide what happens next: what applies on its own and what waits for approval.
02How it works
How the joint report is built
- 01
Add your Windsor.ai key
The key is yours: it comes from a server environment variable or is saved in settings, and Valkiria calls the connectors on your behalf.
- 02
Pull the data on demand
The module queries the connected networks in parallel for the chosen period — the last 30 days by default — and caches each answer for 15 minutes.
- 03
Read one report
Shared KPIs, daily spend, the budget split by platform and top campaigns across every network; anything not connected is listed separately.
03What you get
What the joint report shows
Ten networks in one place
Meta, Google Ads, TikTok, LinkedIn, Reddit, X, Pinterest, Snapchat, Microsoft Ads and Telegram Ads.
01One set of KPIs
Spend, impressions, clicks, CTR, CPC and conversions are counted the same way, so the platforms are finally comparable.
02Budget split at a glance
A single chart shows each network's share of spend, so you see where half the money goes before opening any campaign.
03Top campaigns across networks
The most expensive campaigns line up in one list with their platform, spend, clicks, CTR, CPC and conversions.
04Missing connections stay visible
Platforms without a connection are named explicitly with a link to settings: a gap in the data is never shown as zero spend.
05Read-only by design
The module creates nothing and changes nothing in your ad accounts — it assembles the report and stops there.
0604In numbers
- 10
- ad networks in one joint report
- 15 min
- refresh interval for each network
- 0
- changes made to ad accounts — read only
Who gets what
What each type of client takes away
What you connect
- Ad accounts
- Analytics
- Website
- Bank & invoices
What Valkiria does
- 01Collect spend and results
- 02Find leaks and gaps
- 03Propose next steps
What you get
- Action plan
- Owner report
- Spend control
See every ad budget and what it returns, without opening five dashboards
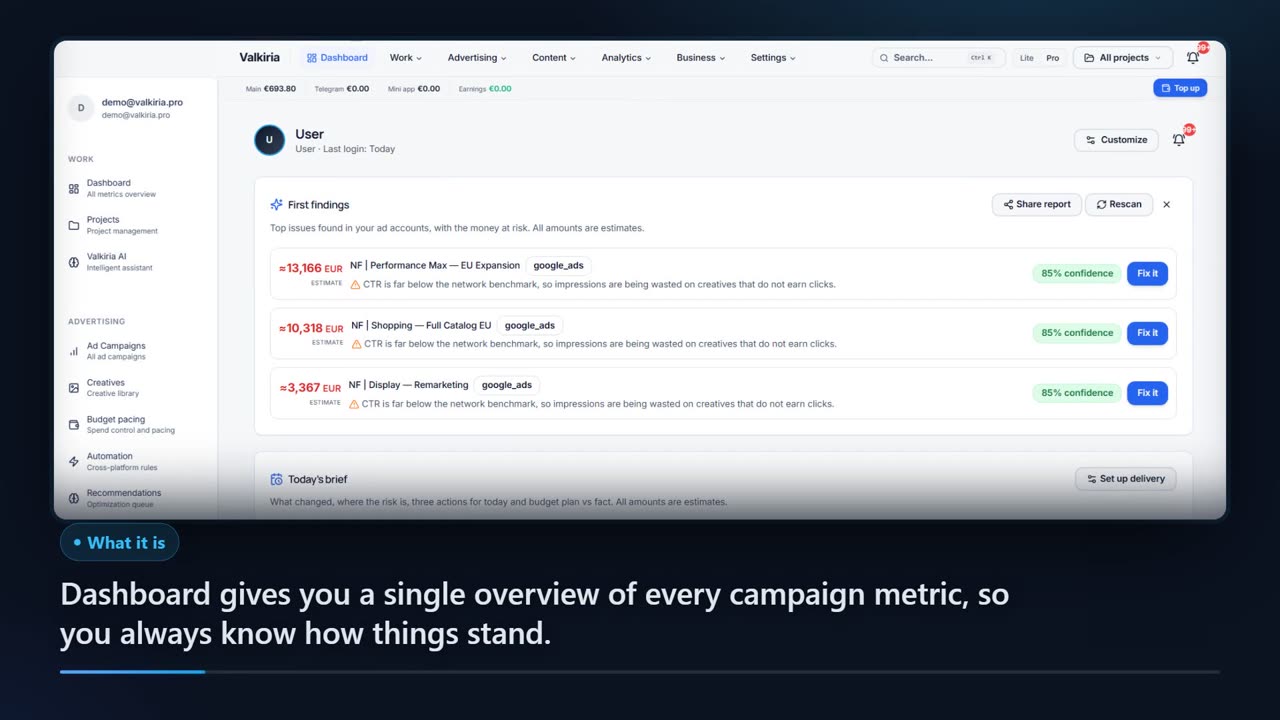
Google, Meta, TikTok and the rest in one view, in your currency, with results next to costs.
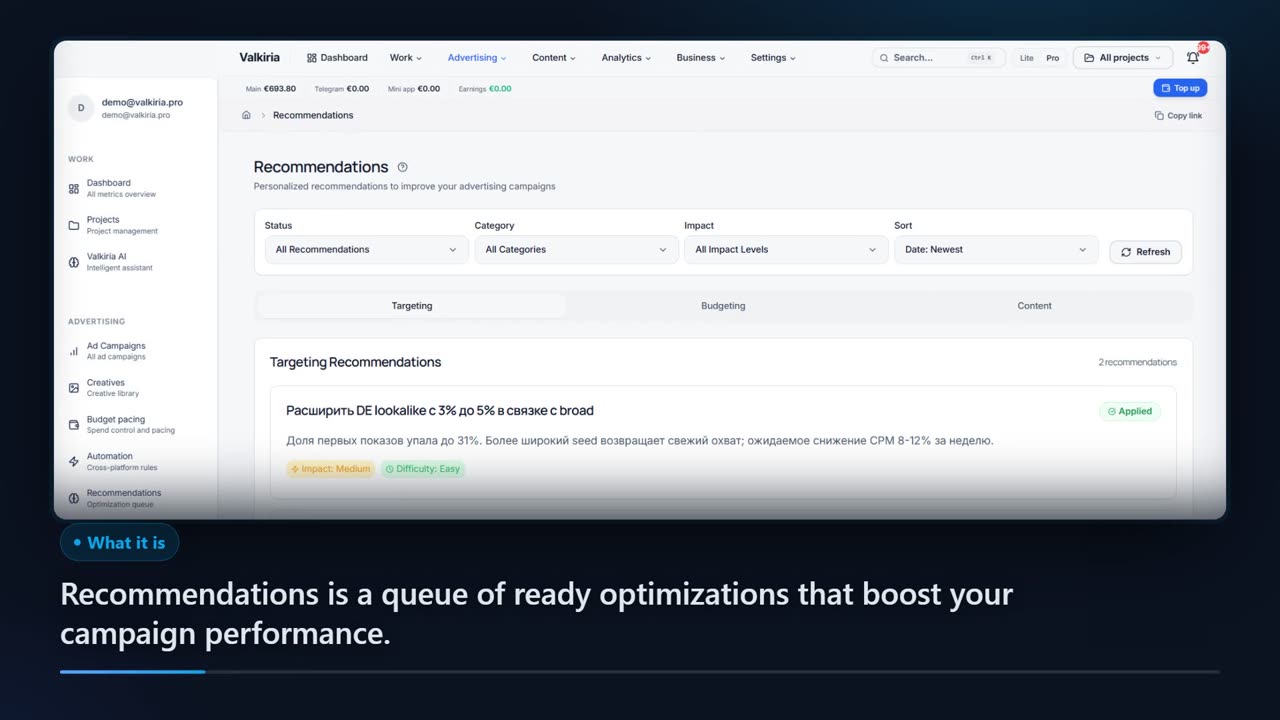
Findings turn into a prioritised list of next steps with the evidence behind each one.
New campaigns are created paused. Edits to live campaigns stay off until you switch them on for an account; deletions and new spend always wait for approval.
Modules that do the work
05FAQ
Questions about cross-platform reporting
06See also
All modulesStart now
See the whole ad spend at once
The Windsor.ai key stays yours, the data is read on demand, and your ad accounts stay untouched.