Every channel in one report, with no invented numbers
Valkiria pulls campaigns, audiences, conversions and money out of your connected ad accounts onto a single screen and shows which sources actually carry the result. Anything an AI computed is labelled an estimate and never passes as measured fact.
01What hurts
Why you have reports and still no answer
The numbers live in five accounts
Meta counts one way, Google another, TikTok a third. The joint view is assembled by hand in a spreadsheet on Monday and is out of date by Tuesday.
Spend is visible, the result is not
Impressions and clicks arrive from the ad accounts on their own; conversions only show up once a pixel and events are wired. Without them the report looks good and says nothing.
The AI states numbers with confidence
An AI dashboard will happily produce a plausible metric with nothing behind it, and a budget decision gets made on a figure that has no source.
Scroll to see it work
Analytics in four moves
- 01Scattered
Without Analytics, this work is spread across spreadsheets and tabs.
- 02Connected
Analytics reads the accounts and data you have already connected.
- 03Found
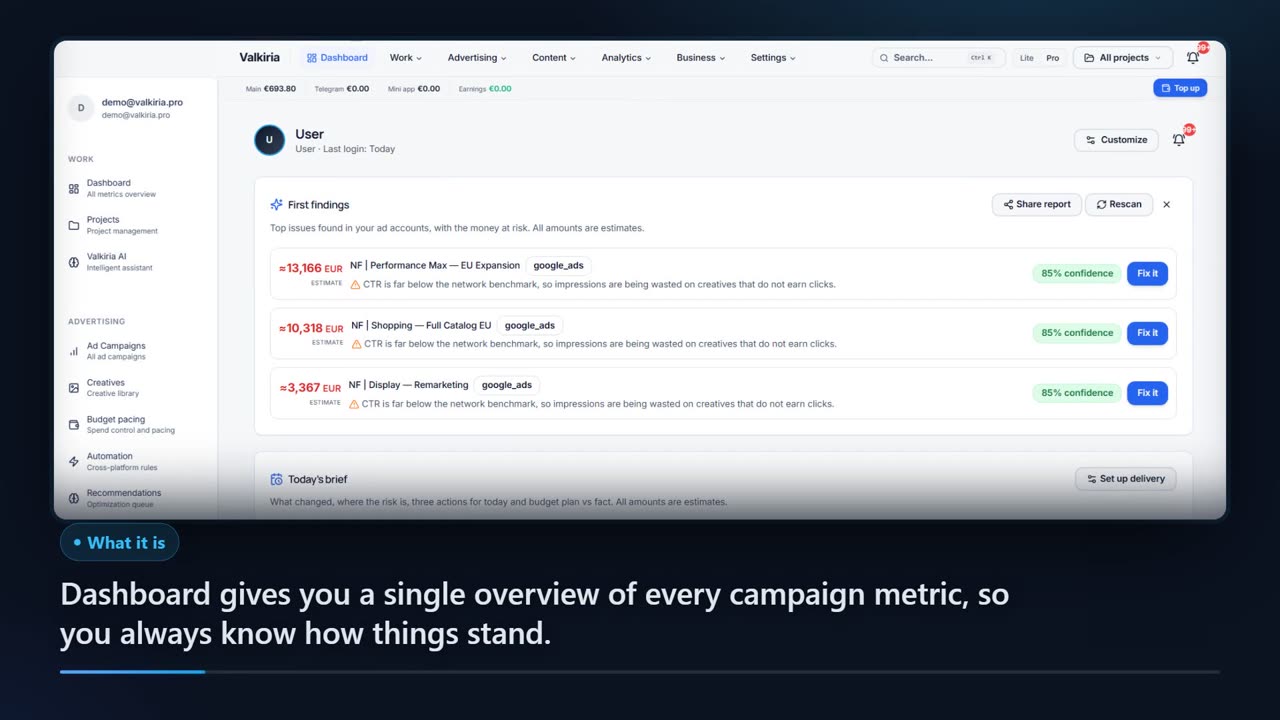
It highlights what matters now, with the evidence behind it.
- 04Approved
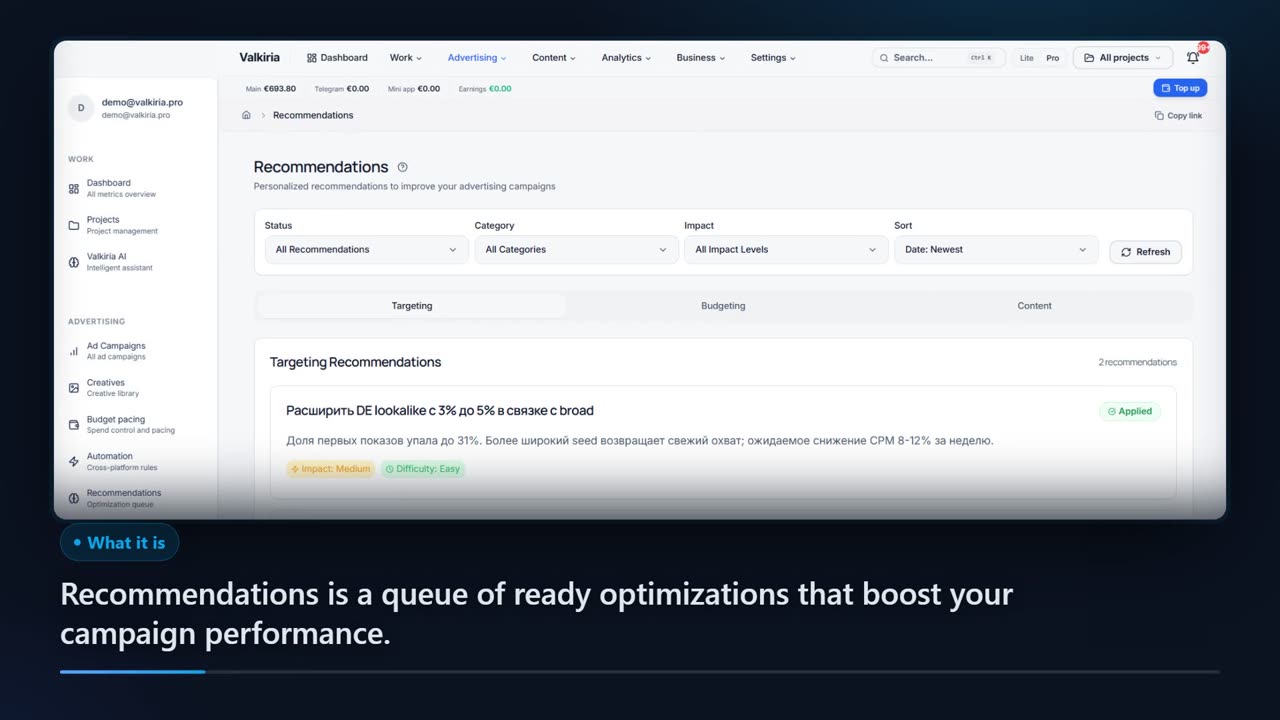
You decide what happens next: what applies on its own and what waits for approval.
02How it works
Three steps to the first honest report
- 01
Connect the sources
Ad accounts connect over OAuth, conversions through the tracking pixel. The setup wizard lists what is still missing and links straight to the screen that fixes it.
- 02
Set the context
Pick a project, client, campaign, platform, ad account and period — the filter applies to every analytics section at once, not to a single chart.
- 03
Read the sections and decide
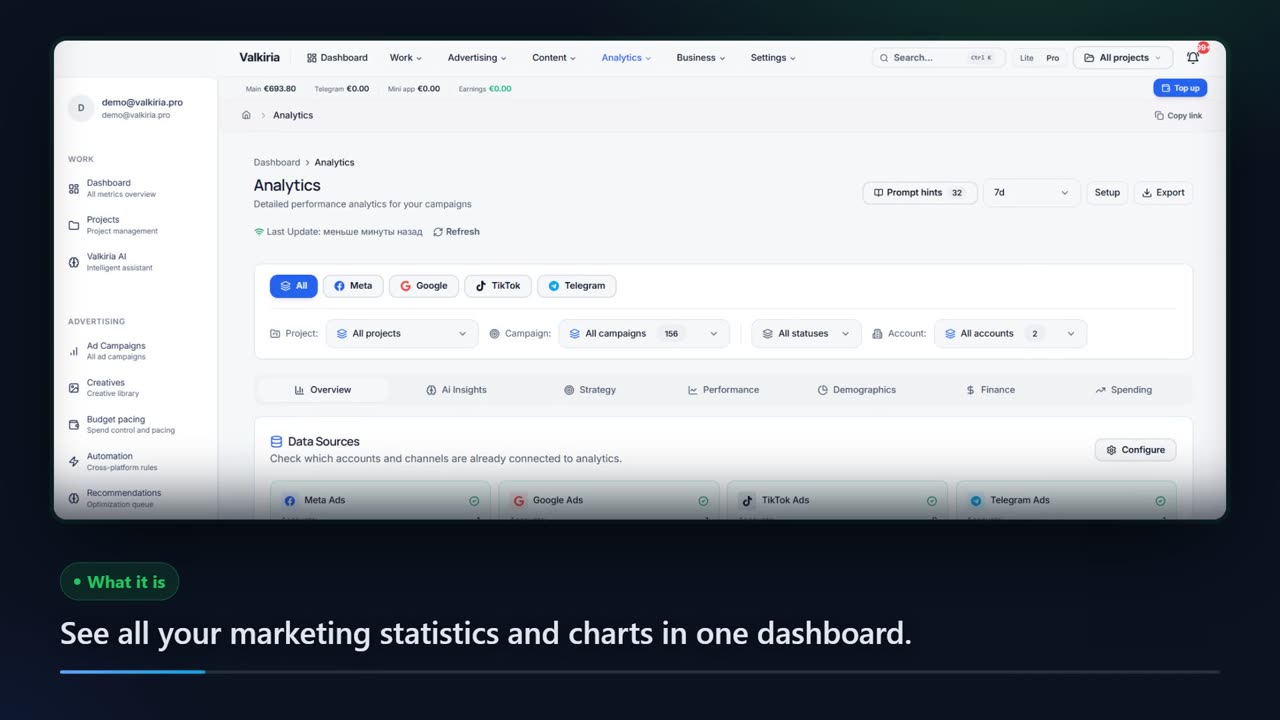
Overview, performance, demographics, finance, spending, strategy and AI insights sit on one screen, and every AI number is marked as an estimate.
03What you get
What a single analytics view gives you
Seven sections, one screen
Overview, performance, audiences, finance, campaign spending, strategy and AI insights — with no bouncing between ad managers.
01Filter by project and client
The same screen serves an agency portfolio and one client's single ad account; the context switches in one click.
02An honest map of your sources
You see how many accounts, campaigns, pixels and events are really connected and which one is silent, with a link to fix it.
03Audiences without exports
Geo, devices, age, gender and interests come from the same accounts and sit next to the spend on those same segments.
04Money kept apart from clicks
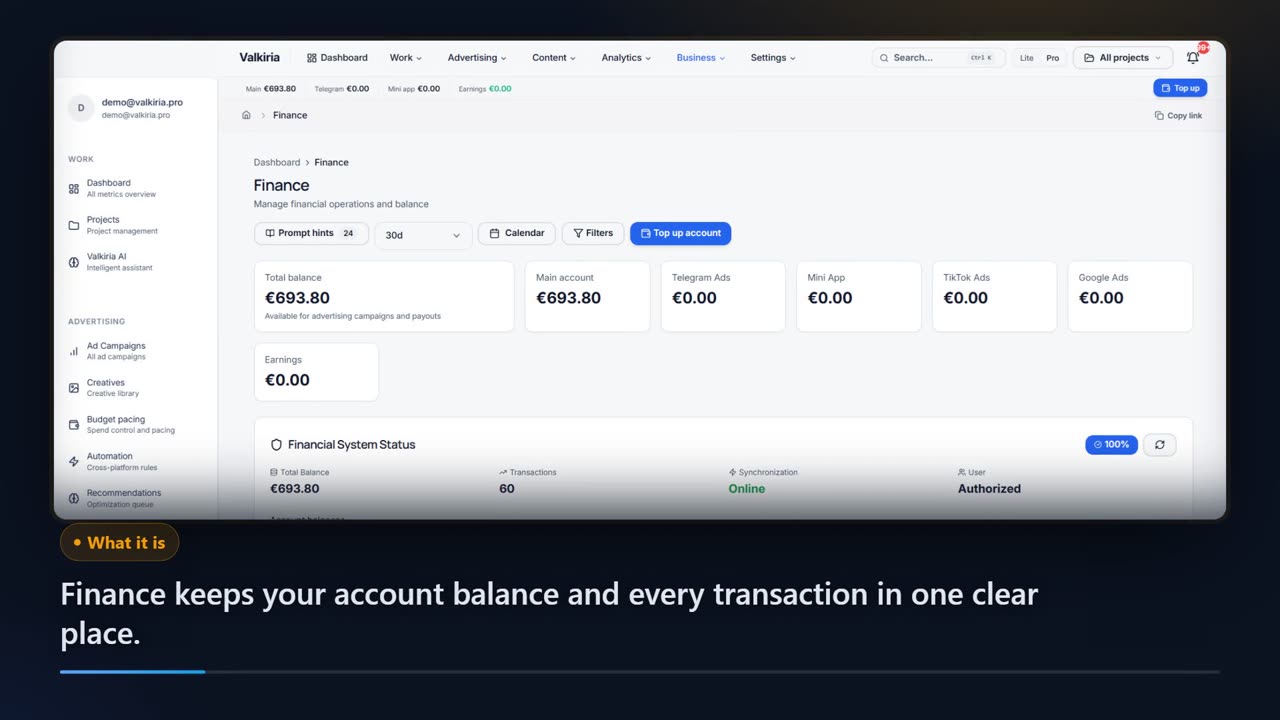
The finance overview and campaign spending are counted in money, so the conversation is about budget rather than impressions.
05Statistics instead of vibes
A/B significance is a real two-proportion z-test: while the sample is thin the system says there is no winner yet instead of naming one.
0604In numbers
- 11
- ad platforms folded into one analytics view
- 7
- analytics sections on a single screen
- 0
- AI numbers presented as measured fact
Who gets what
What each type of client takes away
What you connect
- Ad accounts
- Analytics
- Website
- Bank & invoices
What Valkiria does
- 01Collect spend and results
- 02Find leaks and gaps
- 03Propose next steps
What you get
- Action plan
- Owner report
- Spend control
See every ad budget and what it returns, without opening five dashboards
Google, Meta, TikTok and the rest in one view, in your currency, with results next to costs.
Findings turn into a prioritised list of next steps with the evidence behind each one.
New campaigns are created paused. Edits to live campaigns stay off until you switch them on for an account; deletions and new spend always wait for approval.
Modules that do the work
05FAQ
Questions about advertising analytics
06See also
All modulesStart now
Put every channel in one report
Connecting runs over OAuth and the first pass is read-only. If there is no data yet, the setup wizard shows exactly what to connect.